
On this page
Modern agentic AI systems demand deep observability. When an AI agent fails, it’s important to understand the reason for failure. Was it a bad prompt? A slow tool call? A hallucination? This is where LLM observability platforms become critical.
LangSmith, from the team behind LangChain, and Langfuse, an open-source alternative, are two of the leading platforms designed to solve this problem. Both provide the tracing, evaluation, and monitoring tools needed to build reliable AI applications.
- AI engineers on your agent
- Set up in minutes
- No credit card
However, they are built with different philosophies. In this Langfuse vs LangSmith article, we compare them head-to-head across architecture, features, integrations, and pricing.
Apart from the two tools, we will also talk about how you can use Kitaru (our new open-source tool) on top of Langfuse or LangSmith to get better observability over your evals and traces.
Langfuse vs LangSmith: Key Takeaways
🧑💻 Langfuse: An open-source, framework-agnostic LLM observability and analytics platform. It captures detailed traces across prompts, tools, and evaluations, giving you visibility into latency, cost, and model behavior. Ideal for teams that value transparency, customization, and open integrations across frameworks. ClickHouse acquired Langfuse in January 2026, and Langfuse stays open source and self-hostable.
🧑💻 LangSmith: A managed observability suite by the LangChain team. It features dashboards, alerting, and human-in-the-loop evaluation for production-grade tracing and monitoring. Additionally, it offers in-depth integration with the LangChain and LangGraph ecosystems. If you are all-in on LangChain, LangSmith is the path of least resistance.
Langfuse vs LangSmith: Maturity and Lineage
Before comparing features, a quick understanding of each tool’s development maturity and ecosystem lineage helps you make a more informed choice.
Both Langfuse and LangSmith were launched in the same year, 2023. Langfuse has strong open-source community traction. In comparison, LangSmith’s adoption is great due to its tight integration with the LangChain library.
Here’s a quick table:
| Metric | Langfuse | LangSmith |
|---|---|---|
| First public release | V0.1 – May 2023 | V0.0.1 – June 2023 (Publicly documented pricing and feature rollout became clearer in 2024) |
| GitHub stars | 37.5k+ | 1k+ (SDK repo, archived in October 2026 when the SDKs moved to separate Python and JavaScript repos) |
| Forks | 4.2k+ | 317+ |
| Total commits | 11,000+ | 3,100+ |
| PyPI Downloads | 29.9M per month | 90.5M per month |
| Core philosophy | Open-source, framework-agnostic | LangChain-native, ecosystem-first |
| Notable proof points | Used by Hugging Face, Cohere, and the OpenHands (formerly OpenDevin) community | Adopted by teams using LangChain + LangGraph stack |
Langfuse vs LangSmith: Features Comparison
Let’s compare the core features of both platforms. Here’s a quick overview:
| Feature | Langfuse | LangSmith |
|---|---|---|
| Tracing Model | - Hierarchical traces composed of ‘observations.’ - Comes with strong OpenTelemetry support. | - Hierarchical ‘Run Trees’ composed of ‘runs’ or ‘spans.’ - Deeply native to LangChain/LangGraph. |
| Monitoring | - Real-time dashboards for cost, latency, and user feedback. - Has a metrics API and custom dashboards. | - Pre-built and custom dashboards for traces, errors, token usage, cost, and tool latency. |
| Alerting | Native, threshold-based alerts on cost, latency, and scores, with Slack, PagerDuty, and webhook notifications. | Native, configurable alerts and webhooks for monitoring metrics. |
| Evaluation | Both online and offline. Supports datasets, ‘LLM-as-a-judge,’ and user feedback. | Both online and offline. Supports datasets, LLM-as-a-judge, gold standard evals, and human annotation queues. |
| Prompt Management | Yes. UI-driven prompt management with versioning, a playground, and tags. | Yes. ‘Prompt Hub’ with versioning, a playground, and a ‘Canvas’ for prompt iteration. |
Feature 1. Tracing Depth and Structure
Observability starts with tracing. Both platforms capture the full, hierarchical structure of an LLM call, but they use slightly different terms.
Langfuse
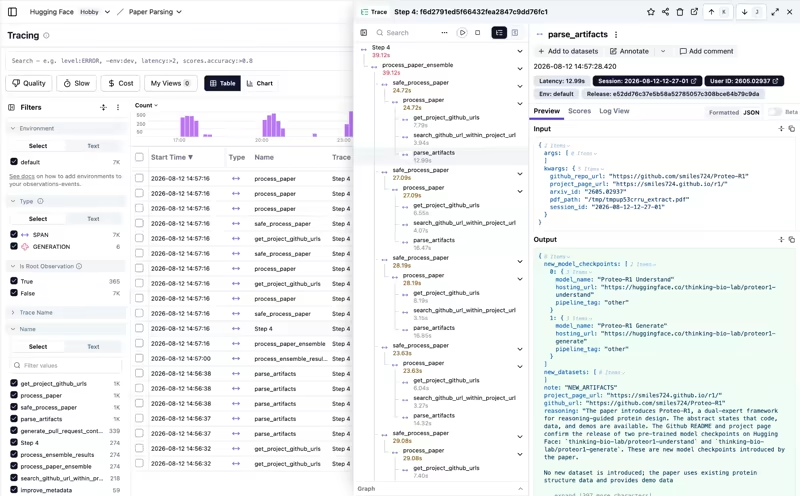
Langfuse captures traces as a collection of ‘observations.’ An observation can be:
- Span: A unit of work, like a function call or a RAG retrieval step.
- Generation: A specialized span for an LLM call, which includes the exact inputs and outputs, rich metadata like model parameters, token counts, and cost.
- Event: A single point-in-time event, like a user click.
Because it’s built on OpenTelemetry, Langfuse can easily integrate with any framework and even stitch together distributed traces (microservices).
You get a detailed, nested view of your application, allowing you to see exactly how a parent agent span leads to a child tool span and then an LLM generation. It tracks cost, latency, and tokens for each step.
**Recent update: **Langfuse has released specific features to make “radically easier to understand and debug” complex, multi-step agents, which is a key challenge your readers face.
LangSmith
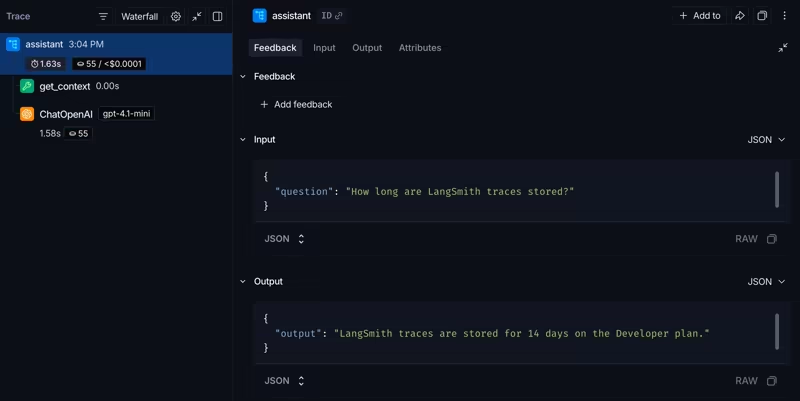
LangSmith uses the ‘Run Tree’ model, which is native to the LangChain Expression Language (LCEL). Each step in a sequence becomes a ‘run’ with parent/child relationships. As if nested to form a tree.
- A parent
runmight be an entire agent execution. - Child
runswould include tool calls, prompt formatting, LLM calls, and output parsing.
Because it’s integrated with LangChain, this tracing is often automatic.
The @traceable decorator lets you wrap any custom Python function and trace it in a run. You can trace inputs, outputs, total tokens, costs, start/end time, errors, etc.
Besides, LangSmith also records events like streaming tokens. The UI allows you to expand any trace to view the details of each node.
🏆 Winner: Langfuse. Both systems support hierarchical traces, but Langfuse’s open Telemetry foundation and language-agnostic SDKs give it an edge in flexibility.
Feature 2. Real-Time Monitoring and Alerting
Once you’re tracing, you need to see the big picture. Does the tool allow you to set dashboards, thresholds, and alerts?
Langfuse
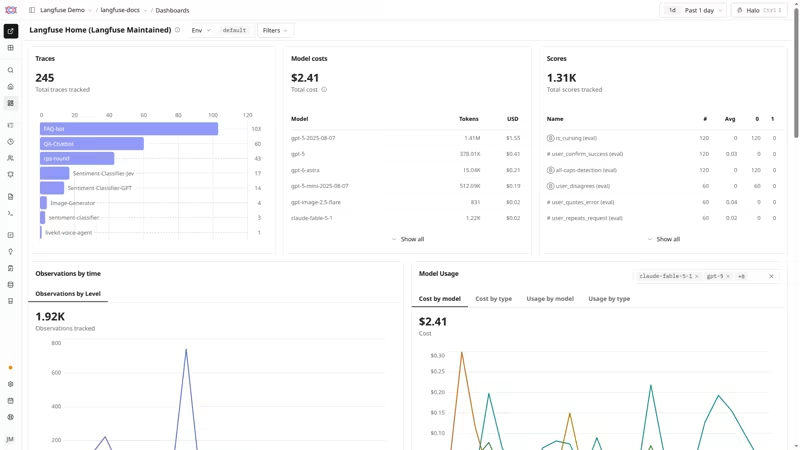
Langfuse provides a real-time analytics dashboard that allows you to monitor key metrics like cost, latency, and quality scores. You can filter these dashboards by user, session, or prompt version.
For security monitoring, you can track scores over time in the Langfuse Dashboard and manually inspect traces to investigate security issues. The platform supports monitoring security scores and validating security checks through its scoring system.
Langfuse also has native alerting. You pick a metric, such as p95 latency, average cost, or an evaluation score, set a threshold and a time window, and Langfuse notifies you over Slack, PagerDuty, a webhook, or a GitHub Actions workflow when the metric crosses it. To alert on errors, record them as scores and alert on those.
You can still use the Metrics API to build custom alerting on top of Langfuse data.
LangSmith
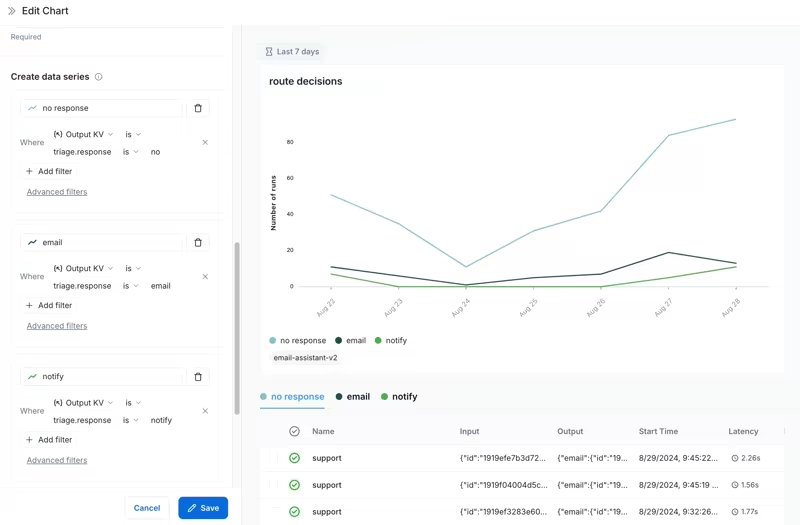
LangSmith has a more mature, out-of-the-box monitoring and alerting solution. It provides:
- Pre-built Dashboards: Automatically generated for each project, monitoring trace counts, error rates, token usage, costs, and tool performance.
- Custom Dashboards: A UI to build your own charts to track specific metrics.
- Native Alerting: You can configure alerts to trigger on events, giving you a complete, self-contained monitoring loop.
For example, you define conditions. Like >5% error rate over 5 minutes, and LangSmith sends notifications via Slack, PagerDuty, Dynatrace, or webhooks when they’re met.
Alerts can hook into LangSmith’s automation engine or webhook integrations, making it easy to get notified of failures or drift. LangSmith also includes an ‘Insights’ section that analyzes your traces to surface usage patterns and failure modes.
🏆 Winner: LangSmith. Both systems offer real-time metrics dashboards and native, threshold-based alerts with Slack, PagerDuty, and webhook notifications. LangSmith adds pre-built dashboards for every project and Insights reports on top of its alerting.
Feature 3. Evaluation Workflows (Online and Offline)
Arguably, this is the most critical feature for production. Otherwise, how do you know if a new prompt is actually better? Langfuse and LangSmith both have their evaluation frameworks.
Langfuse
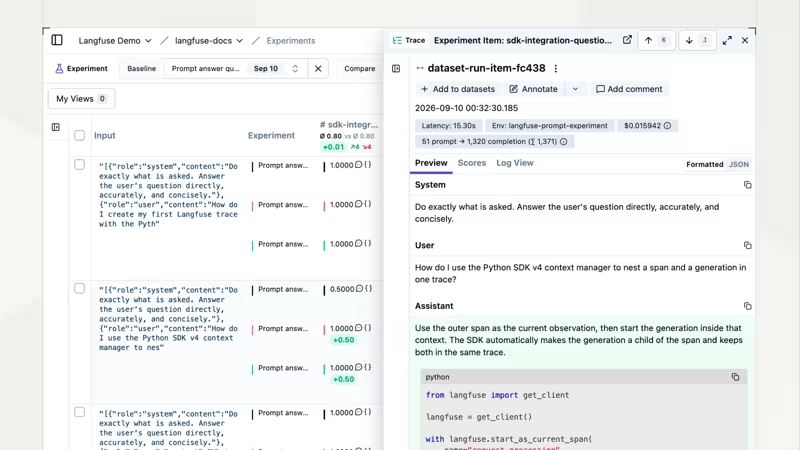
Langfuse’s evaluation methods include automatic LLM-as-Judge scoring, custom Python evaluators, and human annotation.
Langfuse supports both batch (offline) and in-production (online) evaluation:
- Offline Evaluation: You create datasets of input/output examples. You then run your agent against this dataset to score its performance, which is perfect for regression testing in CI/CD.
- Online Evaluation (Live Traffic): You attach evaluators to live production traces. For example, you could run an ‘LLM-as-judge’ on every user query as it happens. All evaluation feedback can be linked back to the original traces. You can also capture and score user feedback.
In its recent update Langfuse added three new and important features to its evaluation functionality:
- Baseline Comparison: You can now set a specific run as a "baseline" to compare against, which is crucial for identifying regressions.
- Annotations in Compare View: Teams can score and comment directly within the experiment comparison UI.
- Experiment Runner SDK: A new SDK abstraction to help run experiments, manage tracing, and execute evaluations.
LangSmith
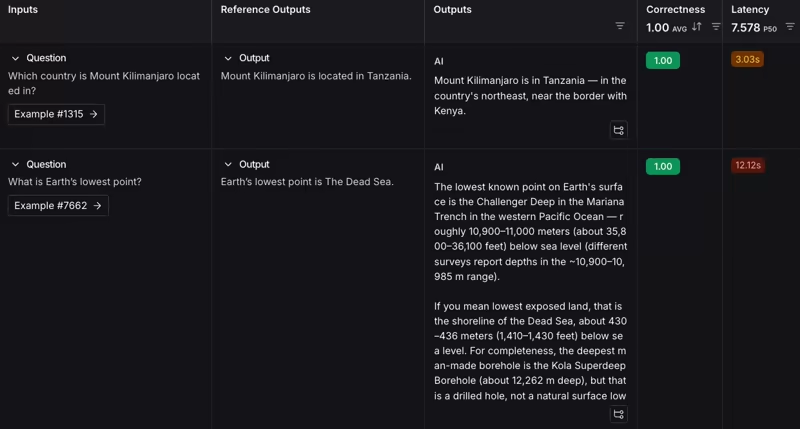
LangSmith offers a similar and robust set of evaluation tools:
- Offline Evaluation: Like Langfuse, you build Datasets in the Studio and run evaluations against them using defined evaluations like LLM scoring, gold-standard comparison, or functional tests.
- Online Evaluation: You can attach evaluators to your production traffic to continuously monitor quality.
- Human Annotation: LangSmith includes an 'Annotation Queue' for human reviewers to label traces and provide feedback scores.
The key differentiator here is LangSmith’s rich evaluator types. It has built-in support for exact match, code-based, and LLM-as-a-judge evaluators. The LangSmith UI brings all this together with tools to compare experiments, analyze regressions, and integrate into CI pipelines.
🏆 Winner: Both platforms cover the essentials like batch evaluations and real-time monitoring. LangSmith stands out for its integrated, user-friendly evaluation tools that are complete with built-in templates, visual workflows, and annotation options. Langfuse is also flexible. You can script anything via the SDK if you have developer resources. However, LangSmith offers more turnkey evaluation support and a smoother human-in-the-loop workflow.
Feature 4. Prompt and Playground Tooling
Managing prompts as strings in your code is a production bottleneck. Both platforms solve this by treating prompts as version-controlled assets.
Langfuse
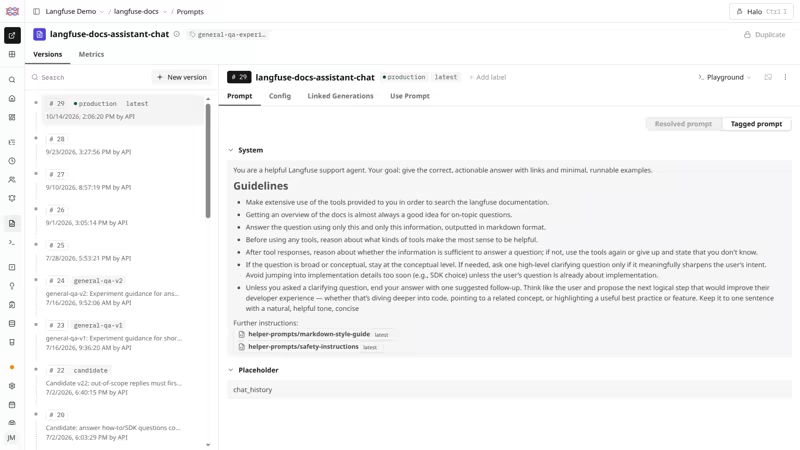
Langfuse has a full Prompt Management system in place. It includes:
- Prompt Versioning and Templates: Every prompt is stored as a versioned artifact with variables and reusable templates. Developers can roll back, branch, or compare versions at any point.
- Interactive Playground: Inside Langfuse’s web UI, you can test different prompt versions, change parameters, and instantly view output in a side-by-side comparison.
- Tool Calling and Structured Output Validation: Validate JSON schemas, test tool calls, and confirm that model responses follow strict output formats.
To deploy a new prompt, you edit it in the UI, test it, and move the production tag to the new version. No code deployment is needed.
LangSmith
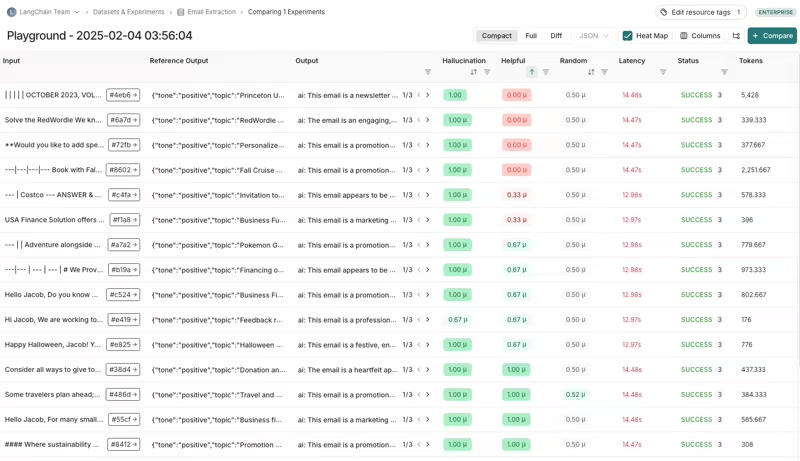
LangSmith offers a Prompt Playground embedded within its Studio environment. It focuses on quick iteration for teams already building with LangChain or LangGraph.
Highlights include:
- Quick prompt editing and execution against different models.
- Uses commit-like SHA hashes for versions, which are familiar to developers. Prompt version saving is tied to project datasets.
- A powerful playground for testing prompts. Playground’s integration with evaluation pipelines allows outputs to be instantly scored or annotated.
- Human-in-the-loop review via the annotation queue.
The Prompt Hub also serves as a community-driven repository where you can find and utilize prompts created by other developers.
🏆 Winner: Langfuse provides deeper prompt management, version control, and validation tooling suitable for multi-framework or open-source stacks. LangSmith’s playground is polished and convenient for LangChain-native teams needing fast, evaluation-linked iteration.
Langfuse vs LangSmith: Integration Capabilities
Langfuse
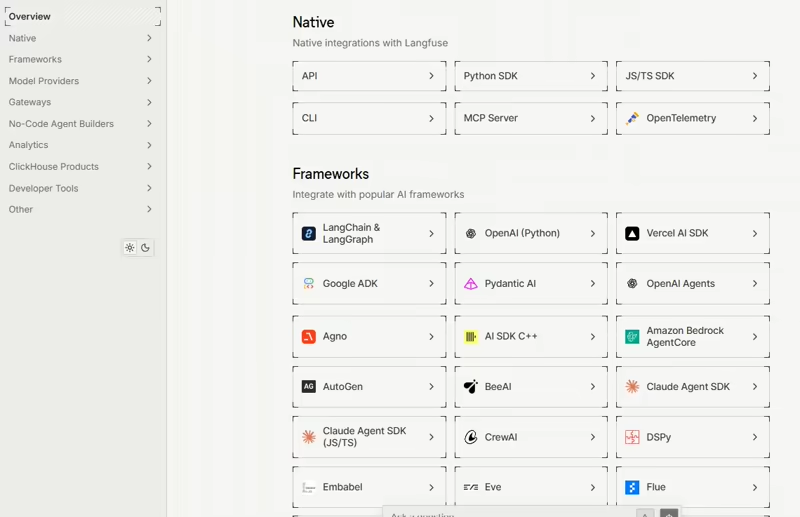
Langfuse is framework-agnostic by design. Its integrations page highlights its ability to work with a huge variety of tools:
- LangChain and LangGraph: Comes with native support.
- LlamaIndex: Yes, native integration.
- AutoGen: Yes, native integration.
- Haystack, Semantic Kernel: Yes.
- Raw SDKs: It provides simple wrappers for the
openai,anthropic, and other SDKs. - OpenTelemetry: It's built on OpenTelemetry, so anything that emits OTEL traces can be ingested.
This makes Langfuse a ‘neutral’ choice. You can plug it into any stack without being locked into a specific agent framework.
LangSmith
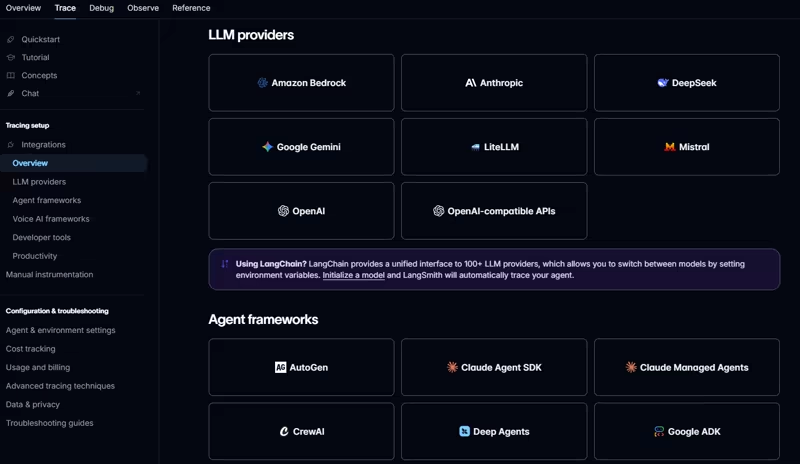
LangSmith’s primary purpose is to be the official, native observability platform for the LangChain ecosystem.
- LangChain and LangGraph: The integration is seamless, deep, and often automatic. It's built into the core of the framework.
- Other Frameworks: It does have integrations for other frameworks like AutoGen, CrewAI, and Semantic Kernel.
LangSmith might obviously be a more integrated and better choice if you’re already using LangChain or LangGraph in your system, since it’s built by the same people.
Langfuse vs LangSmith: Pricing
Langfuse
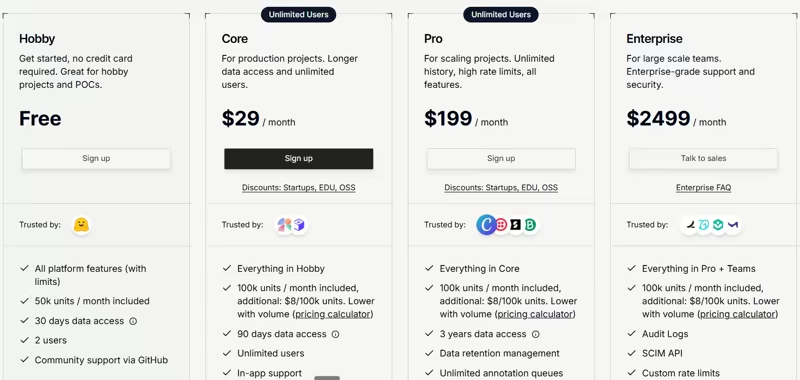
Langfuse is MIT-licensed and free to self-host with unlimited usage. If not, you can pay to host it on the Langfuse cloud with the following pricing models:
- Hobby: A free tier that includes 50,000 'units' (5,000 traces).
- Core: $29 per month
- Pro: $199 per month
- Enterprise: $2499 per month
LangSmith
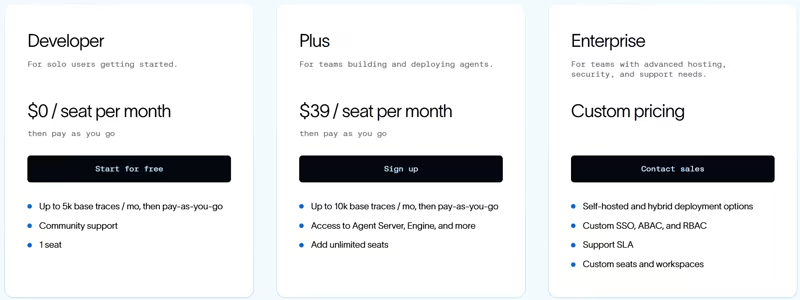
LangSmith’s pricing is seat-based. It offers three plans:
- Developer: Free; 1 user with 5,000 traces/month
- Plus: $39 per seat per month, including 10k base traces per month for the whole organization
- Enterprise: Custom pricing and traces
How Kitaru Turns Your Langfuse or LangSmith Traces into Tested Fixes
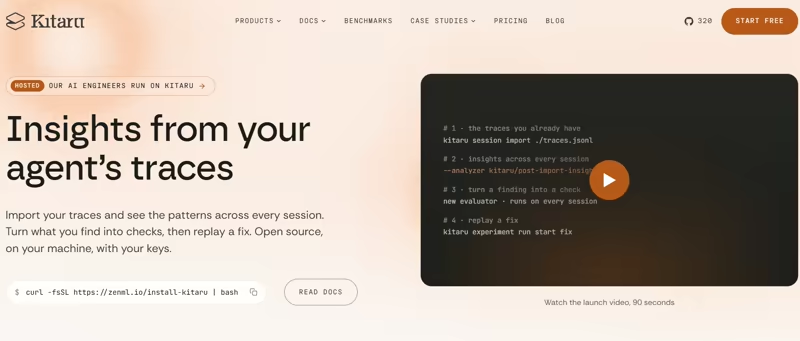
Langfuse and LangSmith show you what your agent did. The next questions are what keeps going wrong, and whether a fix works before your users see it.
Kitaru is ZenML Labs’ open-source tool for agent trace insights, evals, and replay. It works on top of Langfuse and LangSmith rather than replacing them, and it runs on your machine with your own keys.
Here’s how Kitaru helps:
1. Import the Traces You Already Have

Kitaru imports the traces you already collect in Langfuse or LangSmith, with no code changes, and turns each one into a session you can review, check, and replay. It also imports from Braintrust, Logfire, Arize Phoenix, and MLflow. If you would rather record new runs, a one-line adapter wraps agents built with LangGraph, PydanticAI, the OpenAI Agents SDK, the Claude Agent SDK, Mastra, or the Vercel AI SDK.
2. Find What Your Evals Miss

Analyzers read every session at once and surface the patterns you would miss reading traces one by one: failed tool calls, repeated calls, and how outcomes split. You read the sessions behind an insight, and when a pattern turns out to be a real bug, it becomes an evaluator that runs on every session. You can also hand the investigation to Claude Code, Codex, or Cursor with one sentence.
3. Replay a Fix Before It Ships

When you change the prompt, swap the model, or fix the code, Kitaru replays your agent on the sessions that failed. The run happens again against your real code, and tool calls are answered from the recording, so nothing touches live systems. You see what improved and what broke before the change reaches users, and whether a cheaper model holds the same quality.
📚 Related comparison articles to read:
Langfuse vs LangSmith: Which Framework Is Best For You?
The choice between Langfuse and LangSmith is a strategic one that depends on your stack and your scaling philosophy.
Choose Langfuse if:
- Your team is framework-agnostic and uses LlamaIndex, AutoGen, or raw SDKs alongside LangChain.
- You prefer a purely usage-based pricing model for your cloud provider.
Choose LangSmith if:
- You are building primarily with LangChain and LangGraph.
- You want alerting, annotation queues, and managed deployment for your LangGraph agents in one platform.
If you’re interested in taking your AI agent projects to the next level, start with the traces you already have.
Kitaru imports them from Langfuse or LangSmith, shows you what your evals miss, and replays your agent with one change before it ships. Install it with one command: curl -fsSL https://zenml.io/install-kitaru | bash.
When you’re ready to run those agents in robust, production-grade workflows, ZenML integrates whichever agent framework you choose (like CrewAI, LangGraph, and more).
Both are open source under Apache 2.0, and ZenML Pro hosts them for your team from $39 a month, with a 14-day trial and no credit card.
This article was first published in November 2025 and was most recently updated in November 2026.
- AI engineers on your agent
- Set up in minutes
- No credit card