On this page
As machine learning engineers, we’re constantly seeking ways to streamline our workflows, improve collaboration, and gain deeper insights into our models. In this blog post, we’ll explore how integrating ZenML, an open-source MLOps framework, with Comet, a powerful experiment tracking platform, can greatly enhance your ML pipeline management and experimentation process.
The MLOps Challenge
In the world of machine learning, keeping track of experiments, managing model versions, and maintaining reproducibility can quickly become overwhelming. As your projects scale and your team grows, these challenges only intensify. This is where the combination of ZenML and Comet comes in, offering a robust solution to elevate your MLOps game.
Enter ZenML and Comet
ZenML is an extensible, open-source MLOps framework designed to create portable, production-ready machine learning pipelines. It offers a simple, intuitive API that allows you to define your ML workflows as a series of steps, making it easy to manage complex pipelines.
Comet is a platform for tracking, comparing, explaining, and optimizing experiments and models. It provides a centralized place to log hyperparameters, metrics, code, and artifacts, making it easier to collaborate and iterate on your ML projects.
When combined, these tools offer a powerful solution for managing your entire ML lifecycle, from experimentation to production.
Why Integrate ZenML and Comet?
- Seamless Experiment Tracking: Automatically log metrics, parameters, and artifacts from your ZenML pipelines to Comet experiments.
- Enhanced Visibility: Visualize your pipeline results in Comet's intuitive UI, making it easy to compare runs and share insights with your team.
- Simplified Workflow: Enable Comet tracking in your ZenML steps with minimal code changes.
- Improved Collaboration: Organize experiments with automatic tags based on pipeline names and runs, making it easier for team members to find and understand relevant experiments.
- Flexible Configuration: Fine-tune your experiment tracking setup using ZenML's
CometExperimentTrackerSettings.
Getting Started
Let’s walk through the process of integrating ZenML and Comet into your ML workflow.
Step 1: Installation and Setup
First, make sure you have ZenML installed and the Comet integration enabled:
pip install zenml
zenml integration install comet -y
Next, you’ll need to configure your Comet credentials. The recommended way is to use ZenML secrets:
zenml secret create comet_credentials \\
    --workspace=<WORKSPACE> \\
    --project_name=<PROJECT_NAME> \\
    --api_key=<API_KEY>
Now, register the Comet experiment tracker in your ZenML stack:
zenml experiment-tracker register comet_tracker \\
    --flavor=comet \\
    --workspace={{comet_credentials.workspace}} \\
    --project_name={{comet_credentials.project_name}} \\
    --api_key={{comet_credentials.api_key}}
After registering the Comet experiment tracker, you need to create a new stack that includes this component. Here’s how you can do that with a default orchestrator and artifact store:
zenml stack register custom_stack -e comet_tracker -o default -a artifact --setThe --set flag at the end sets this new stack as your active stack.
Step 2: Integrating Comet in Your ZenML Pipeline
Here’s an example of how to use the Comet experiment tracker in a ZenML pipeline:
from comet_ml.integration.sklearn import log_model
from sklearn.model_selection import train_test_split
from sklearn.datasets import load_iris
from sklearn.svm import SVC
from sklearn.metrics import accuracy_score
from zenml import pipeline, step
from zenml.client import Client
from zenml.integrations.comet.experiment_trackers import CometExperimentTracker

# Get the experiment tracker from the active stack
experiment_tracker: CometExperimentTracker = Client().active_stack.experiment_tracker

@step(experiment_tracker=experiment_tracker.name)
def train_model() -> SVC:
    iris = load_iris()
    X_train, _, y_train, _ = train_test_split(
        iris.data, iris.target, test_size=0.2, random_state=42
    )
    model = SVC(kernel="rbf", C=1.0)
    model.fit(X_train, y_train)

    # Log the model to Comet
    log_model(
        experiment=experiment_tracker.experiment,
        model_name="SVC",
        model=model,
    )

    return model

@step(experiment_tracker=experiment_tracker.name)
def evaluate_model(model: SVC):
    iris = load_iris()
    _, X_test, _, y_test = train_test_split(
        iris.data, iris.target, test_size=0.2, random_state=42
    )
    y_pred = model.predict(X_test)
    accuracy = accuracy_score(y_test, y_pred)

    # Log metrics using Comet
    experiment_tracker.log_metrics({"accuracy": accuracy})

    return accuracy

@pipeline
def ml_pipeline():
    model = train_model()
    accuracy = evaluate_model(model)

if __name__ == "__main__":
    ml_pipeline()
In this example, we’ve created two steps: train_model and evaluate_model. Both steps are decorated with @step(experiment_tracker=experiment_tracker.name), which enables Comet tracking for these steps.
Step 3: Customizing Experiment Settings
Now, when you run your pipeline, ZenML will automatically create Comet experiments for each step where tracking is enabled. You can view these experiments in the Comet UI by visiting https://www.comet.com/{WORKSPACE_NAME}/{PROJECT_NAME}/experiments/. For more fine-grained control over your Comet experiments, you can use CometExperimentTrackerSettings:
from zenml.integrations.comet.flavors.comet_experiment_tracker_flavor import (
    CometExperimentTrackerSettings,
)

comet_settings = CometExperimentTrackerSettings(
    tags=["production", "v1.0"],
    run_name="my_custom_run_name",
)

@step(
    experiment_tracker="comet_tracker",
    settings={
        "experiment_tracker": comet_settings
    }
)
def my_custom_step():
    # Your step logic here
    ...
This allows you to add custom tags, set specific run names, and configure other Comet-specific settings for your experiments.
The Result: Your MLOps pipelines are supercharged with advanced experiment tracking capabilities
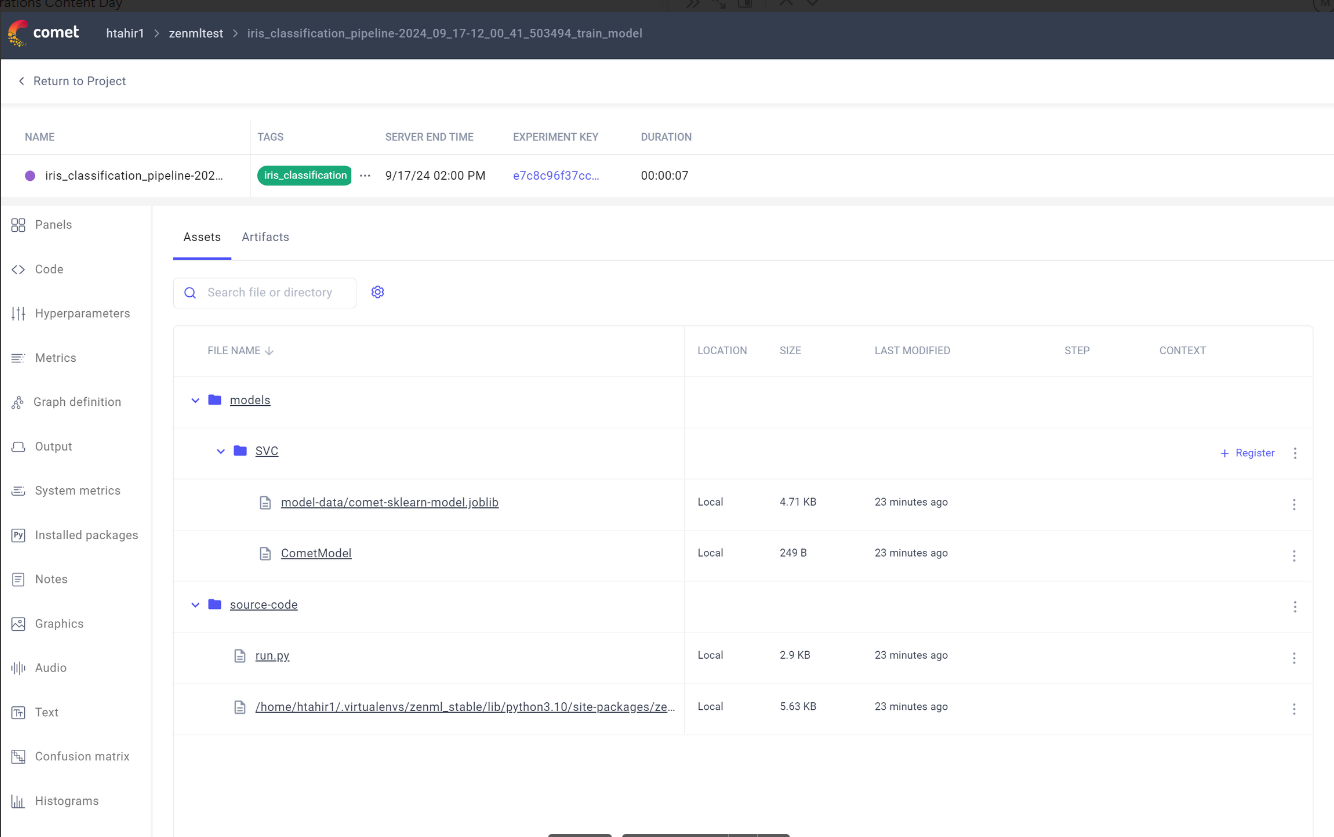
Comet provides a powerful, intuitive web-based UI as a central hub for exploring and analyzing your tracked experiments. When you use the Comet experiment tracker in your ZenML pipeline, each step that has Comet tracking enabled creates a separate experiment in Comet. This granular approach allows for detailed tracking and analysis of individual components within your ML workflow.
In the Comet UI, you can:
** 1. View Experiment Details**: For each ZenML step, you’ll find a corresponding Comet experiment that includes logged metrics, parameters, artifacts, and code.
** 2. Compare Experiments**: Easily compare different runs of your pipeline or different steps within a single run to identify changes and improvements.
** 3. Analyze Metrics and Plots**: Visualize your logged metrics with Comet’s built-in charting tools, helping you quickly identify trends and anomalies.
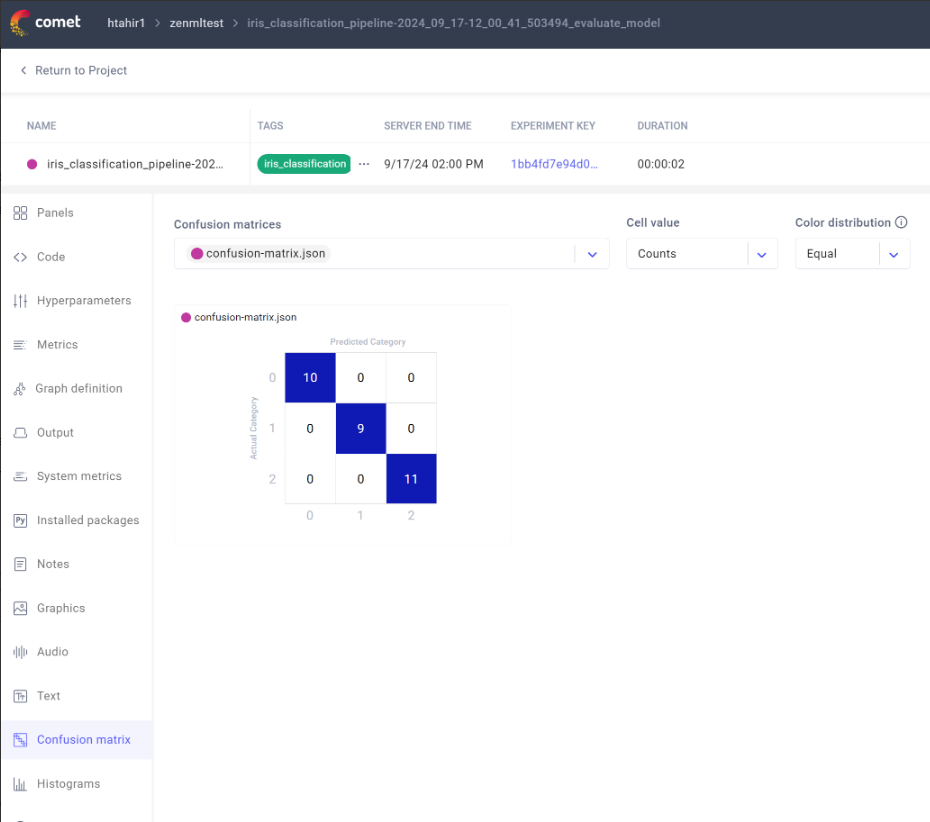
**4. Examine Model Performance: **For steps that involve model training or evaluation, you can dive deep into model performance metrics, confusion matrices, and more.
** 5. Collaborate with Team Members**: Share experiment results, add notes, and collaborate with your team directly within the Comet interface.
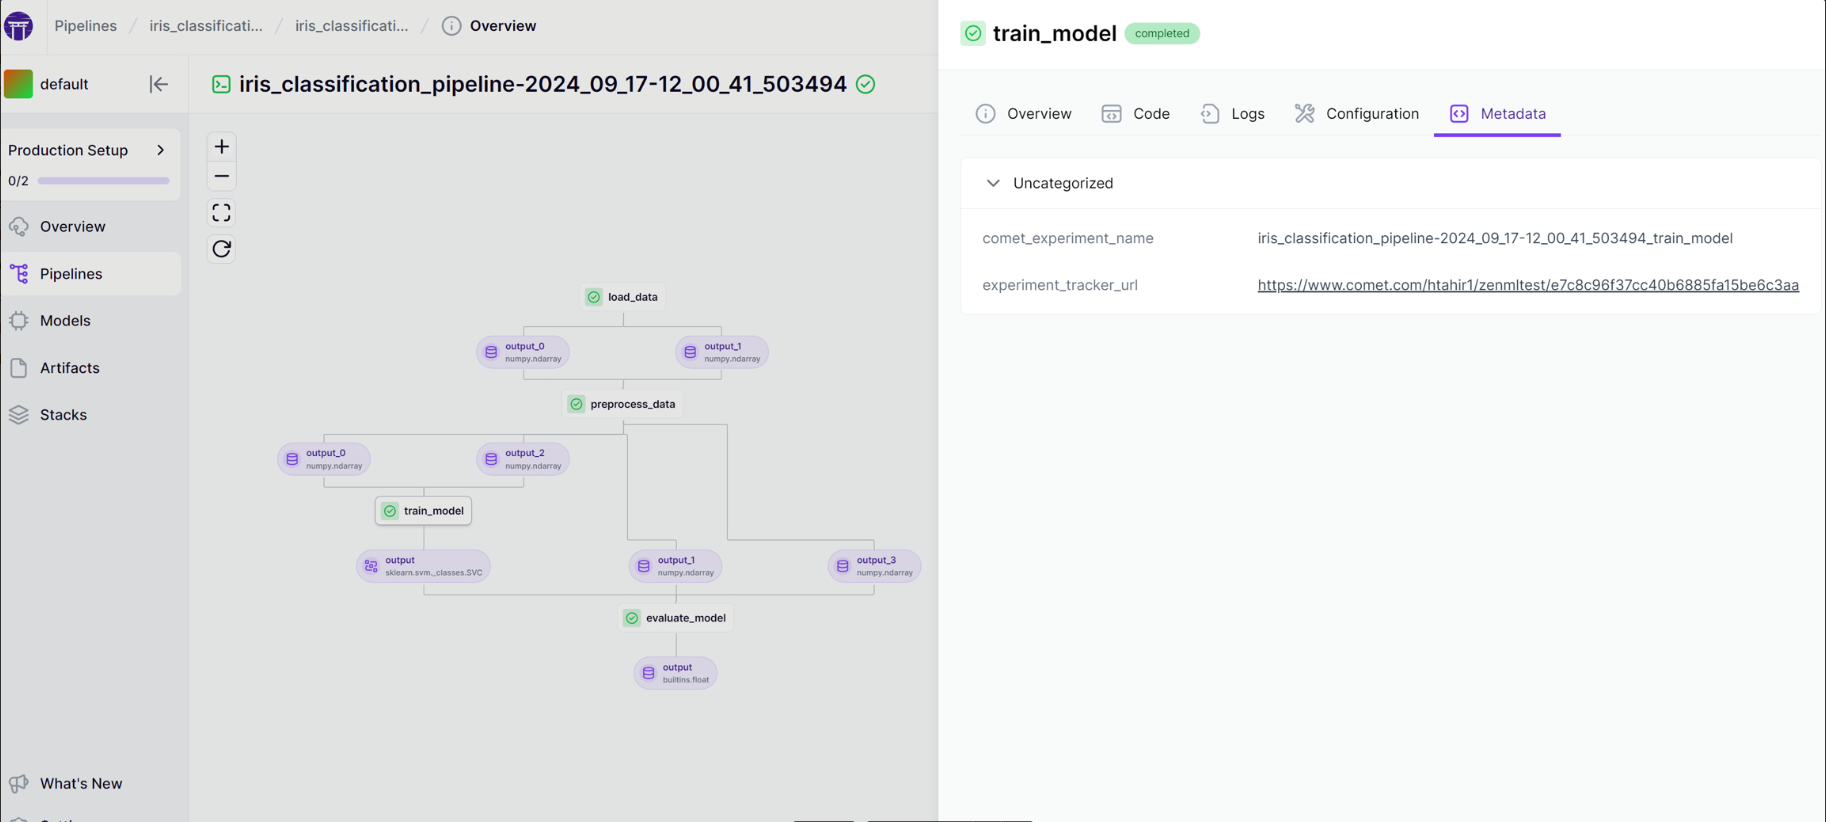
On the ZenML side, to access the Comet experiment URL for a specific ZenML run, you can use the following code:
from zenml.client import Client

last_run = client.get_pipeline("<PIPELINE_NAME>").last_run
trainer_step = last_run.get_step("<STEP_NAME>")
tracking_url = trainer_step.run_metadata["experiment_tracker_url"].value
print(tracking_url)
Or directly from the ZenML dashboard. This will provide a direct link to the Comet experiment associated with a particular step in your ZenML pipeline.
Alternatively, you can see an overview of all experiments at https://www.comet.com/{WORKSPACE_NAME}/{PROJECT_NAME}/experiments/.
Conclusion
Integrating ZenML and Comet provides a powerful solution for managing your ML workflows and tracking experiments. By combining ZenML’s pipeline management capabilities with Comet’s robust experiment tracking features, you can:
- Automate the logging of metrics, parameters, and artifacts
- Easily visualize and compare pipeline runs
- Improve collaboration within your team
- Maintain reproducibility across your ML projects
As machine learning projects grow in complexity, tools like ZenML and Comet become invaluable for maintaining organization, improving efficiency, and driving innovation. By adopting this integrated approach, you’re setting yourself up for success in the fast-paced world of machine learning and MLOps.
Ready to supercharge your ML workflows? Give the ZenML-Comet integration a try and experience the benefits for yourself!