On this page
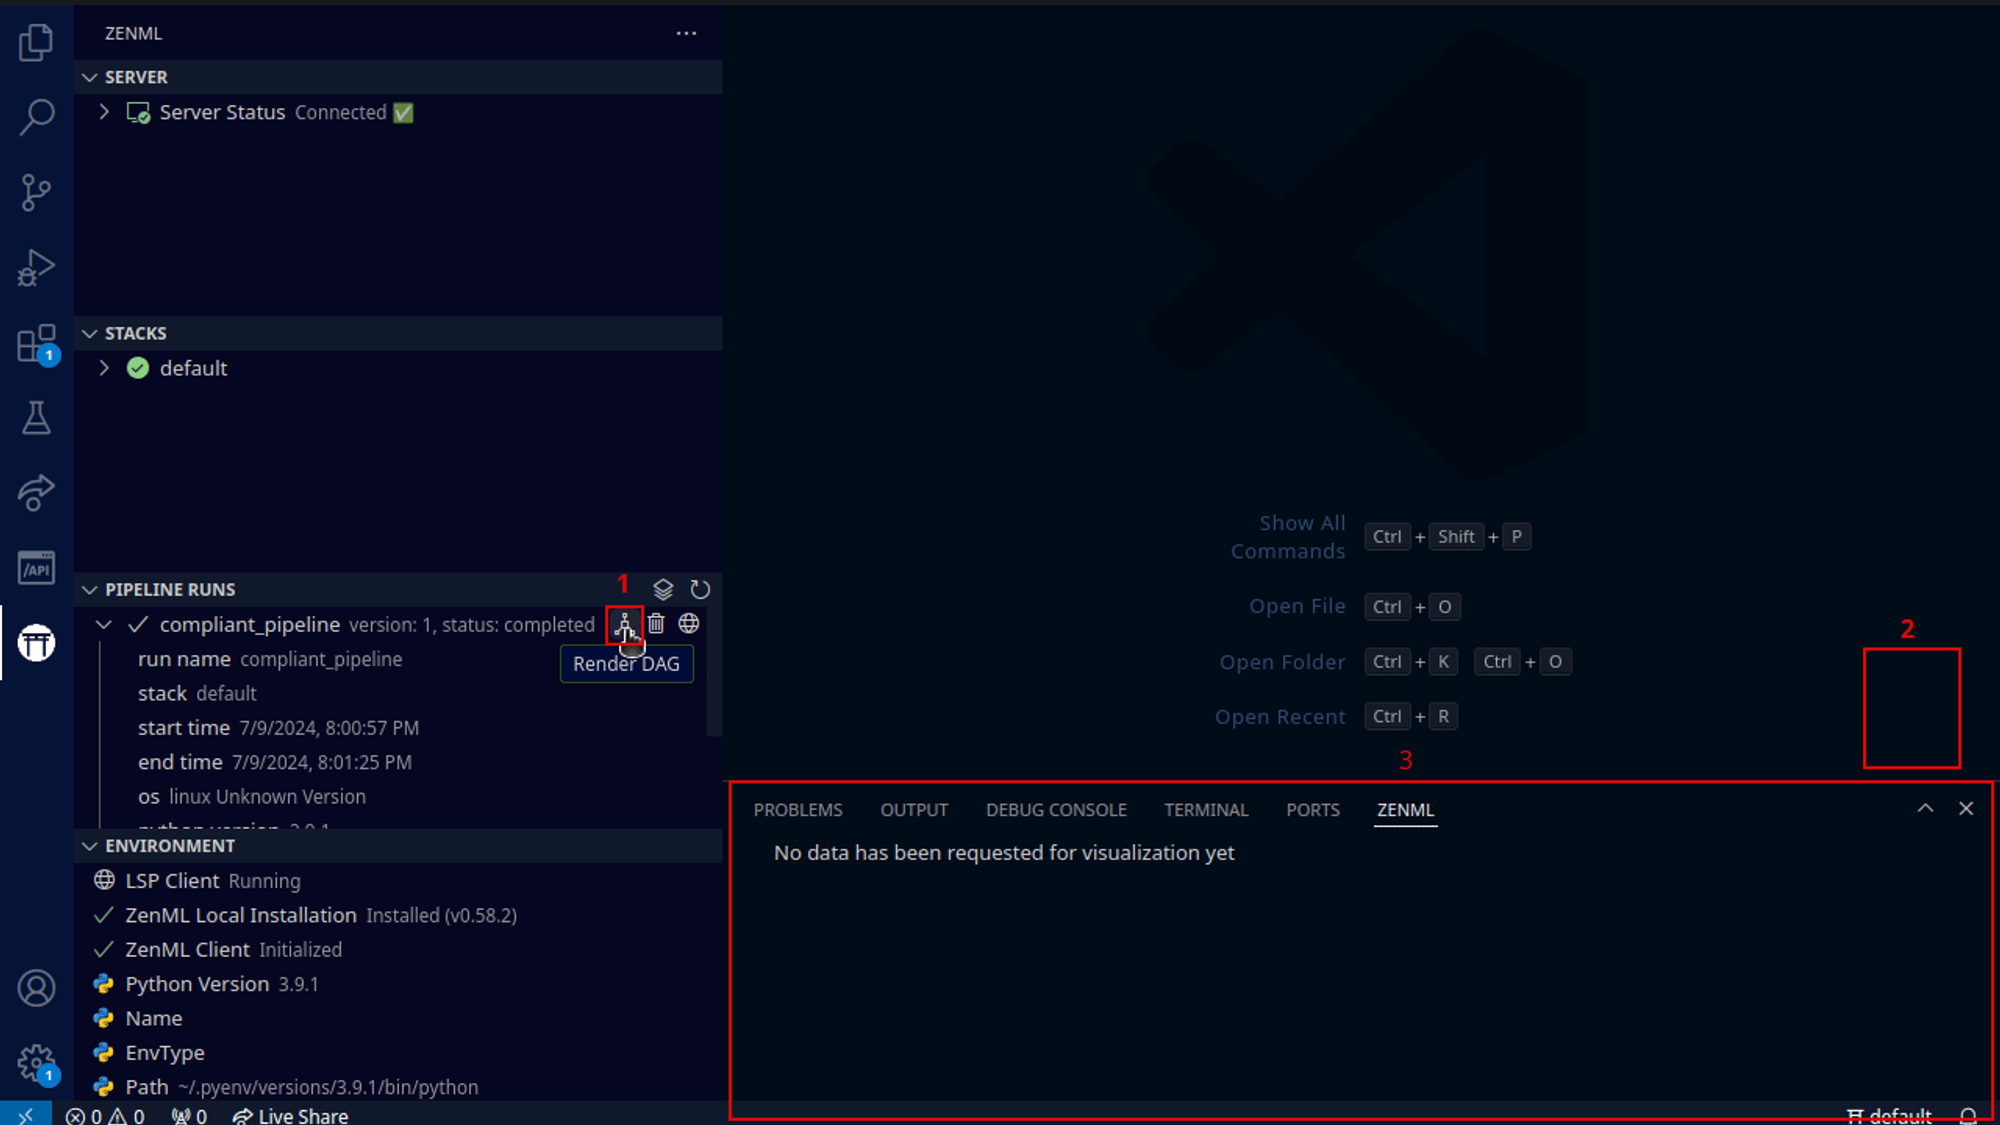
The latest version of the ZenML Studio VS Code Extension (v0.0.11) now supports DAG visualization and stack/component registration directly from within your VS Code / IDE. By adding the ability to view DAGs directly from VS Code, developers no longer need to visit the web dashboard while running pipelines. Being able to register, update, and delete both stack components and stacks from VS Code is also quite advantageous.
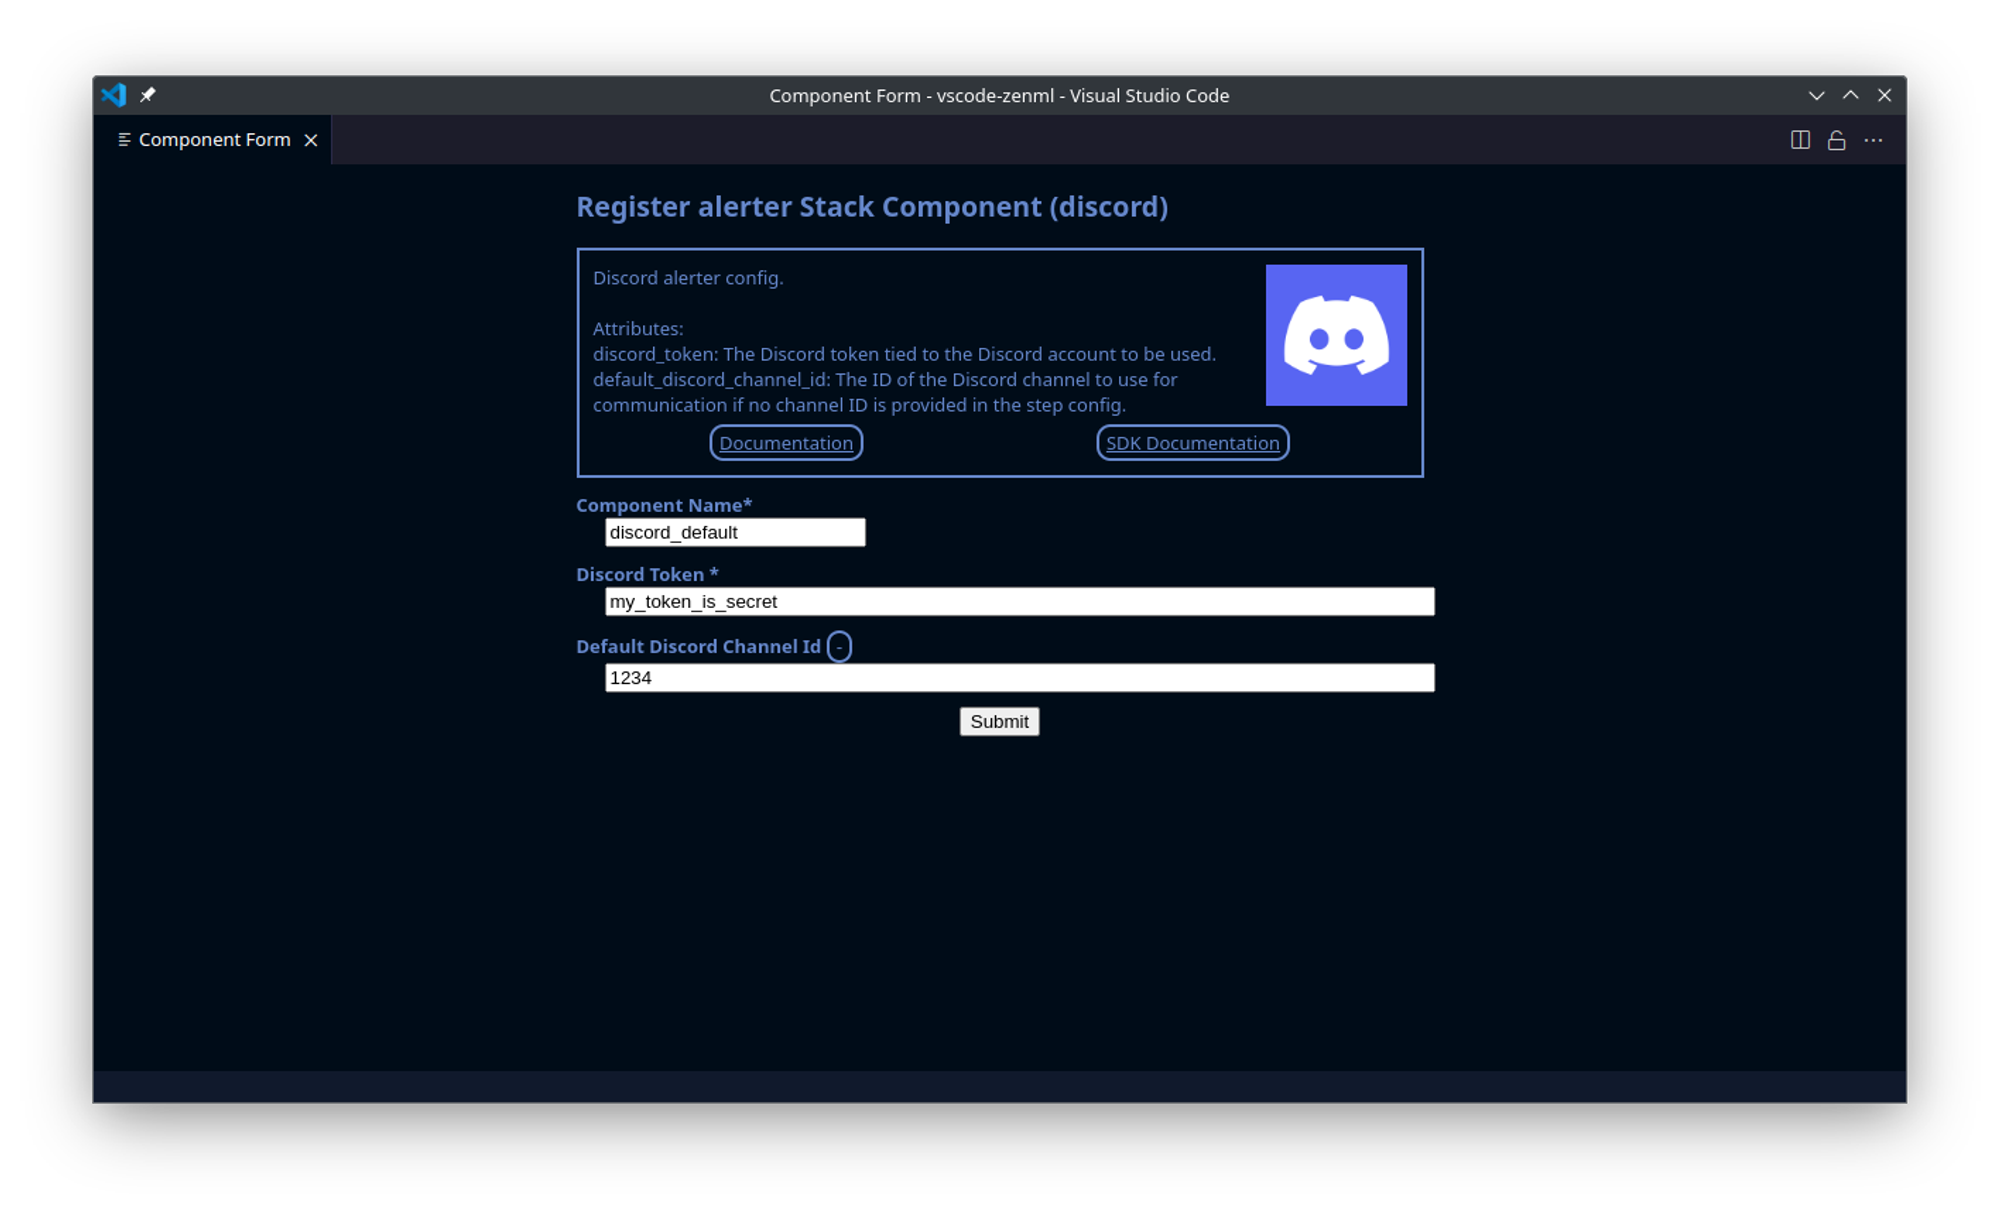
Previously, a developer would have to use the CLI to do any of these features. That required looking at documentation to know what data to provide and the syntax to feed the command and typing out the command manually:
zenml alerter register --flavor discord discord_default \
 --discord_token="my_token_is_secret" --default_discord_channel_id=123
“Now, the forms are generated with all necessary fields and interacting with both stacks and components is just a click away.
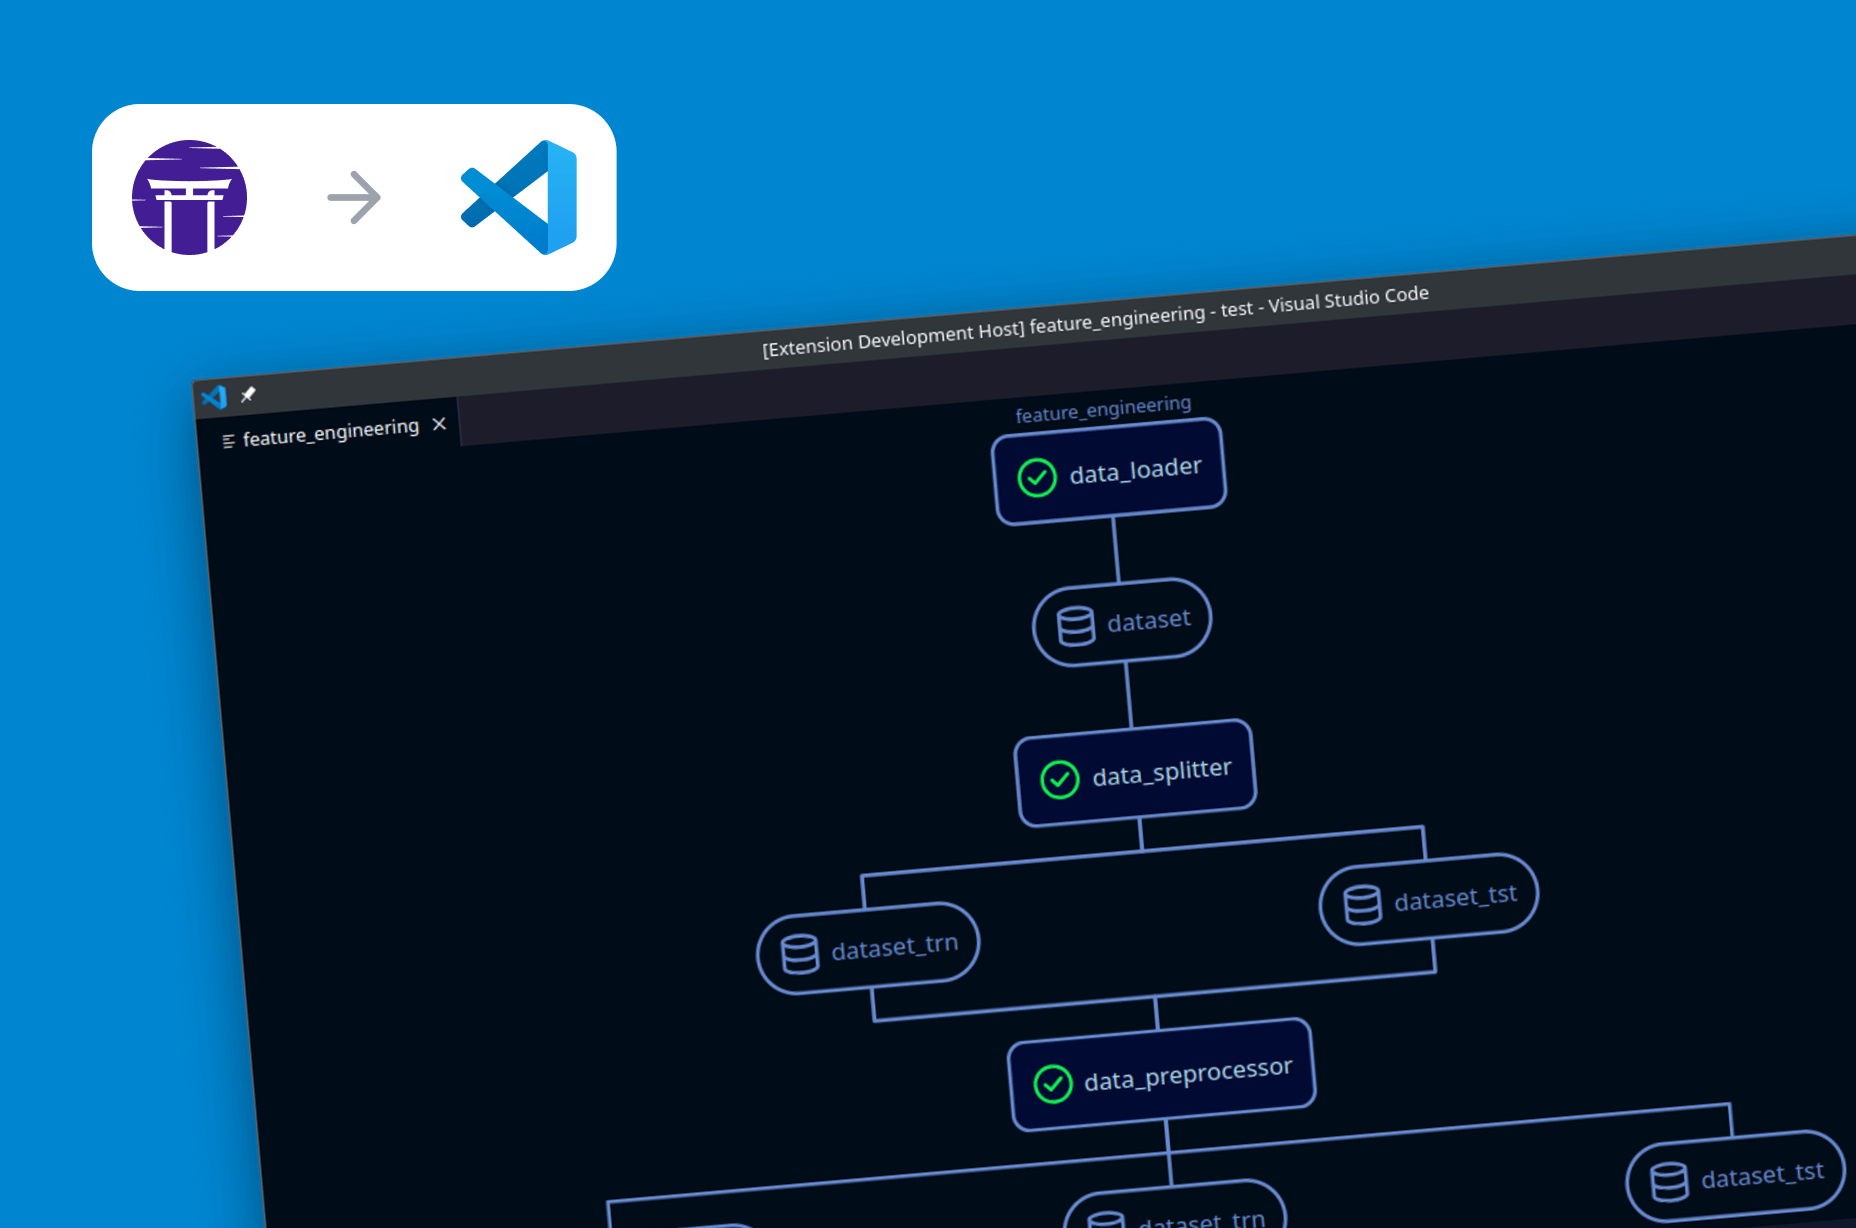
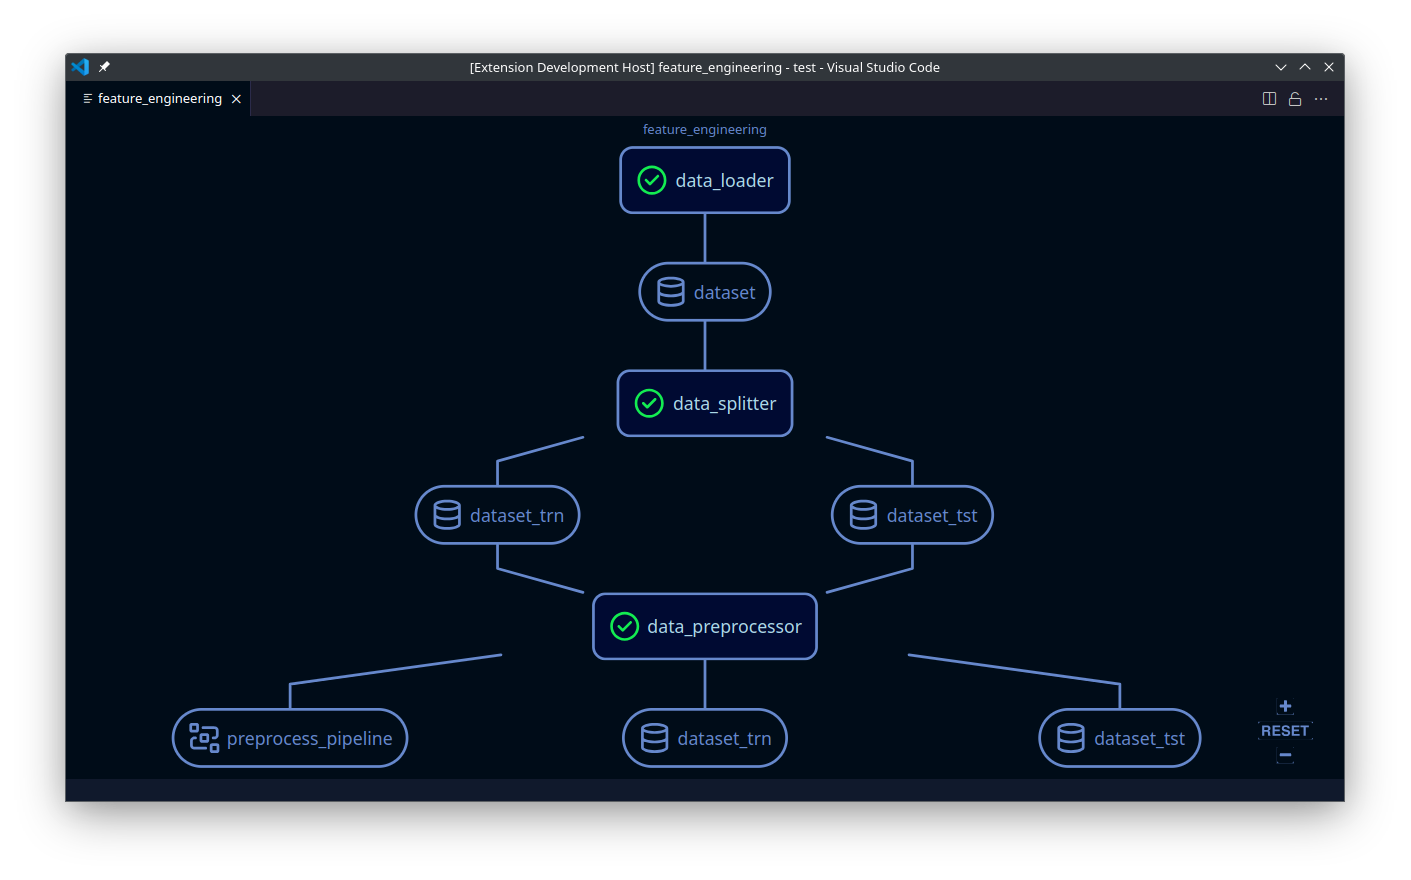
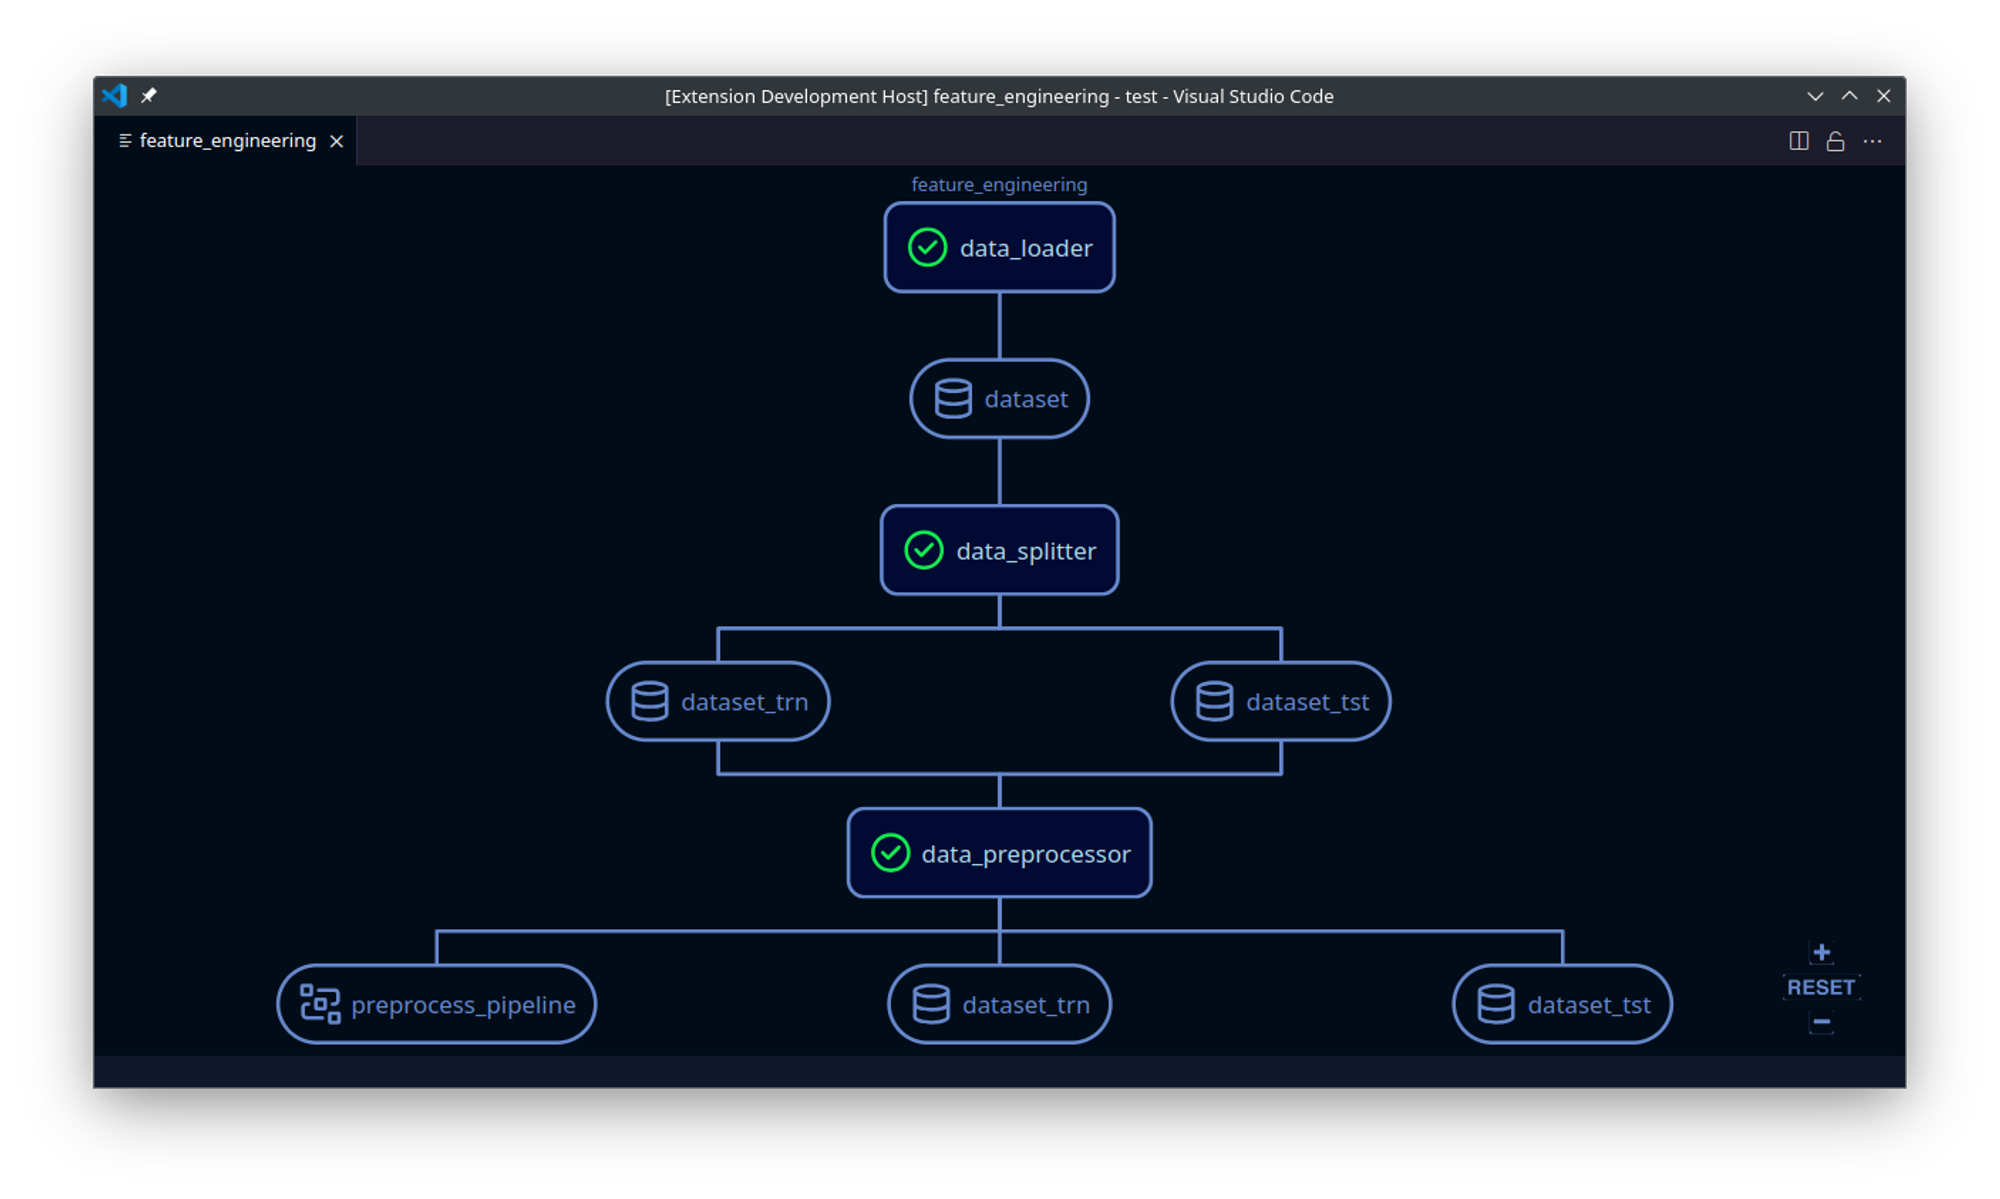
Building on Marwan’s foundation and initial implementation, I took on the challenge of building these features, focusing on creating aesthetically pleasing and user-friendly interfaces. In this article, I will address some of the more interesting parts of implementing the features. Here you can see the DAG visualizer in action:
Webviews
Visual Studio Code doesn’t offer a direct API for displaying graphs or complex forms. Instead, it utilizes a feature called ‘webviews,’ which allows developers to render web pages within the editor. Built on Electron (and thus Chromium and Node.js), VS Code can render these web pages in a sandboxed environment. This setup lets developers specify which resources the webview can access and enables communication with the main VS Code instance through messaging.
When using webviews, there are several important considerations. First, webviews lose their context by default when hidden. Although it’s possible to retain context, doing so increases memory usage, as each webview instance runs its own scripts. Additionally, unlike a typical website, users may not always be online when accessing VS Code, so relying on online resources is not advisable.
Sandboxed
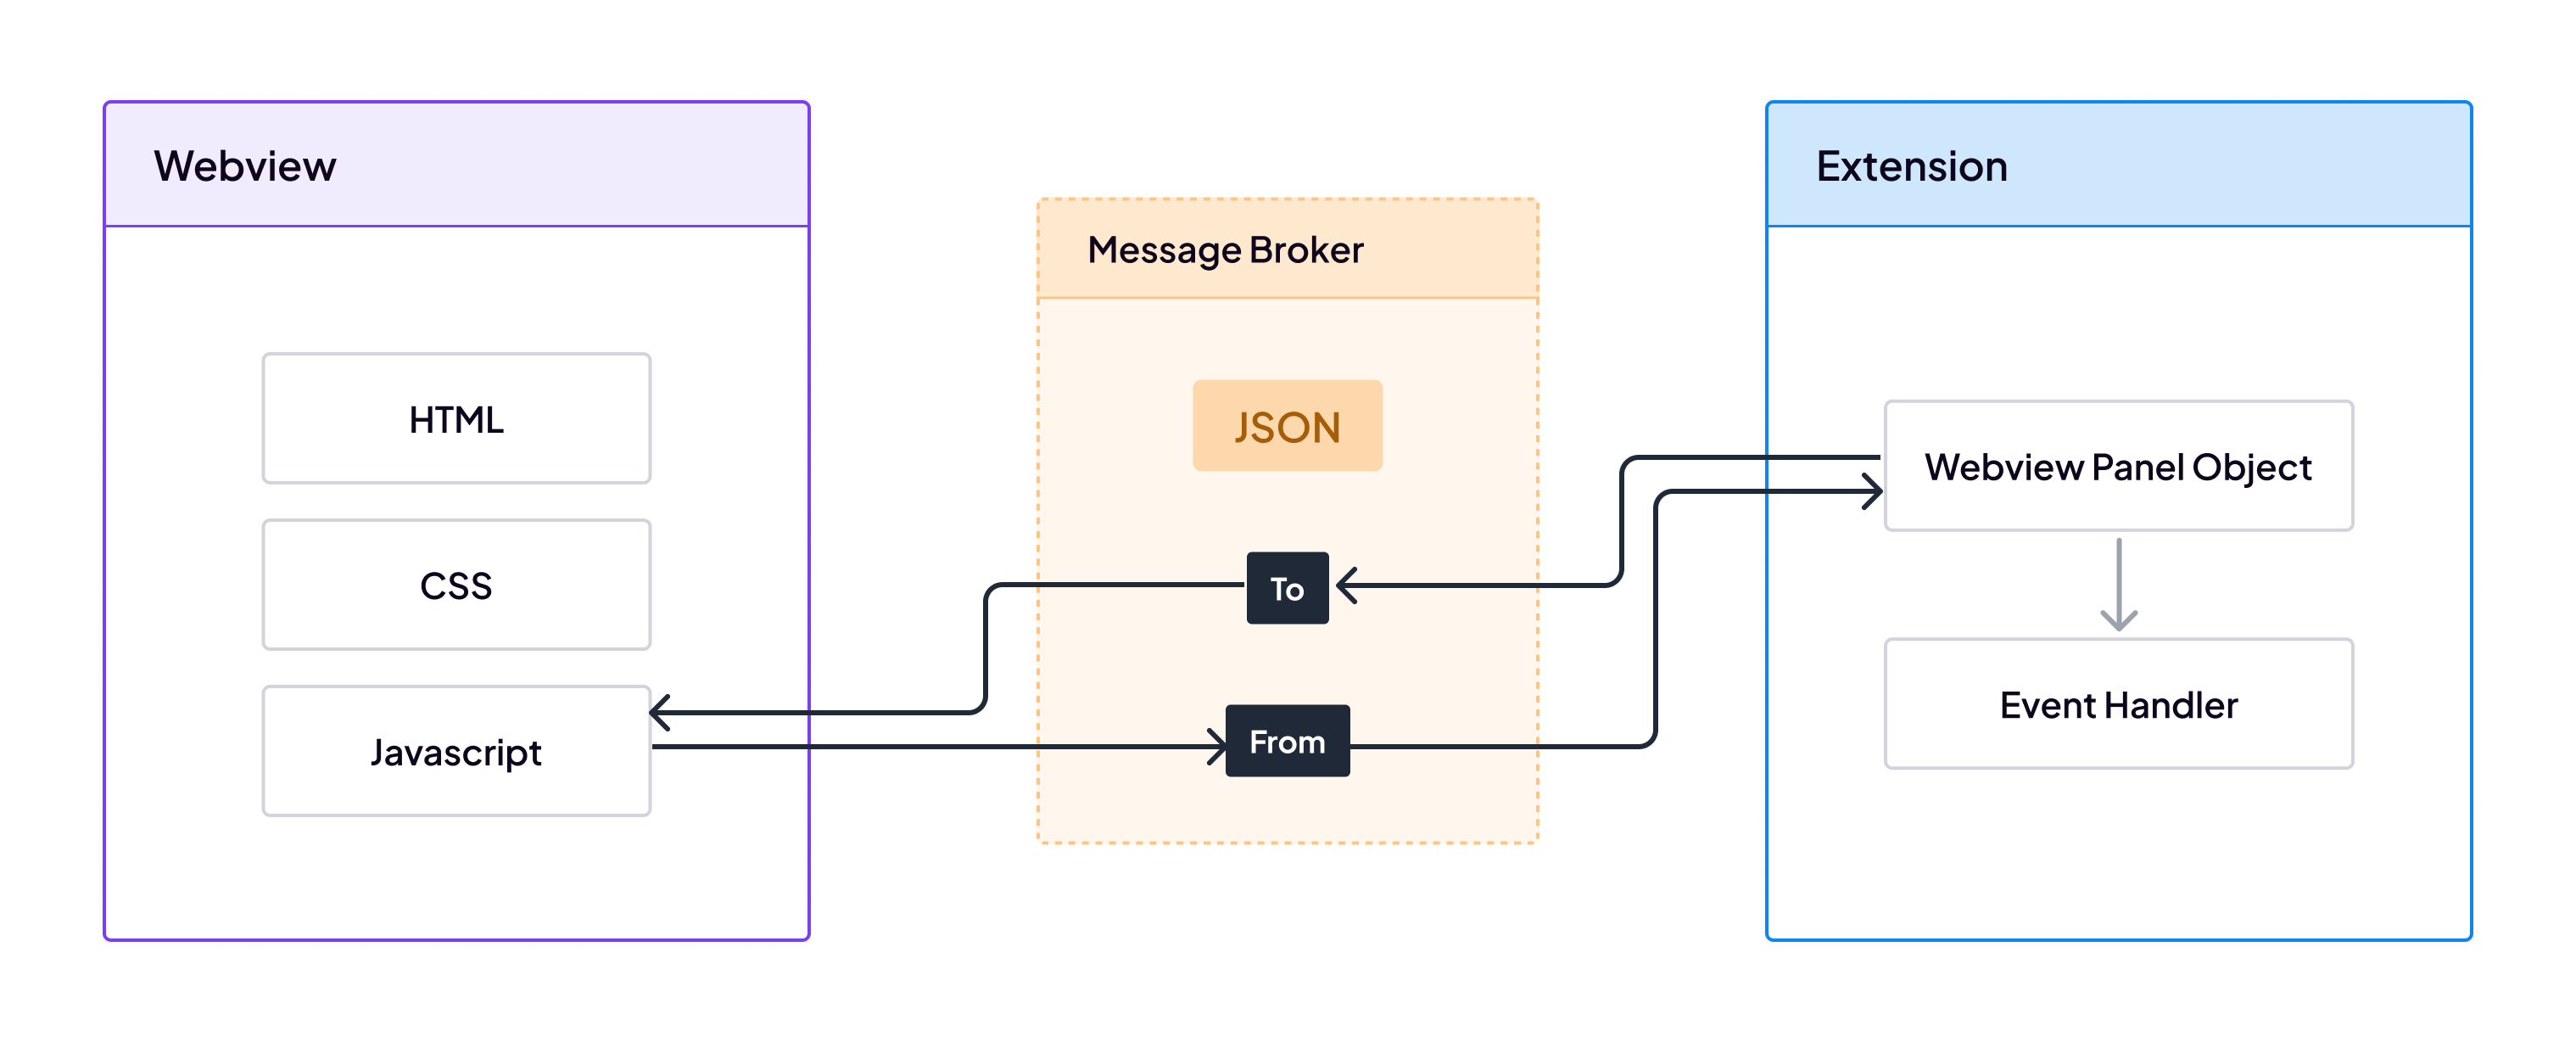
With webviews being sandboxed from the rest of the project, understanding how to communicate between the JavaScript embedded in the webview and the extension itself is crucial. VS Code provides a message queue between the webview and the parent extension, which is the only method to exchange data between the two.
If we were to render everything inside the webview, the data would need to be sent to it via messages. If context retention was disabled, this process would have to be repeated every time the webview was shown. These limitations led to the decision to pre-render the webviews, ensuring that rendering occurs only once at creation.
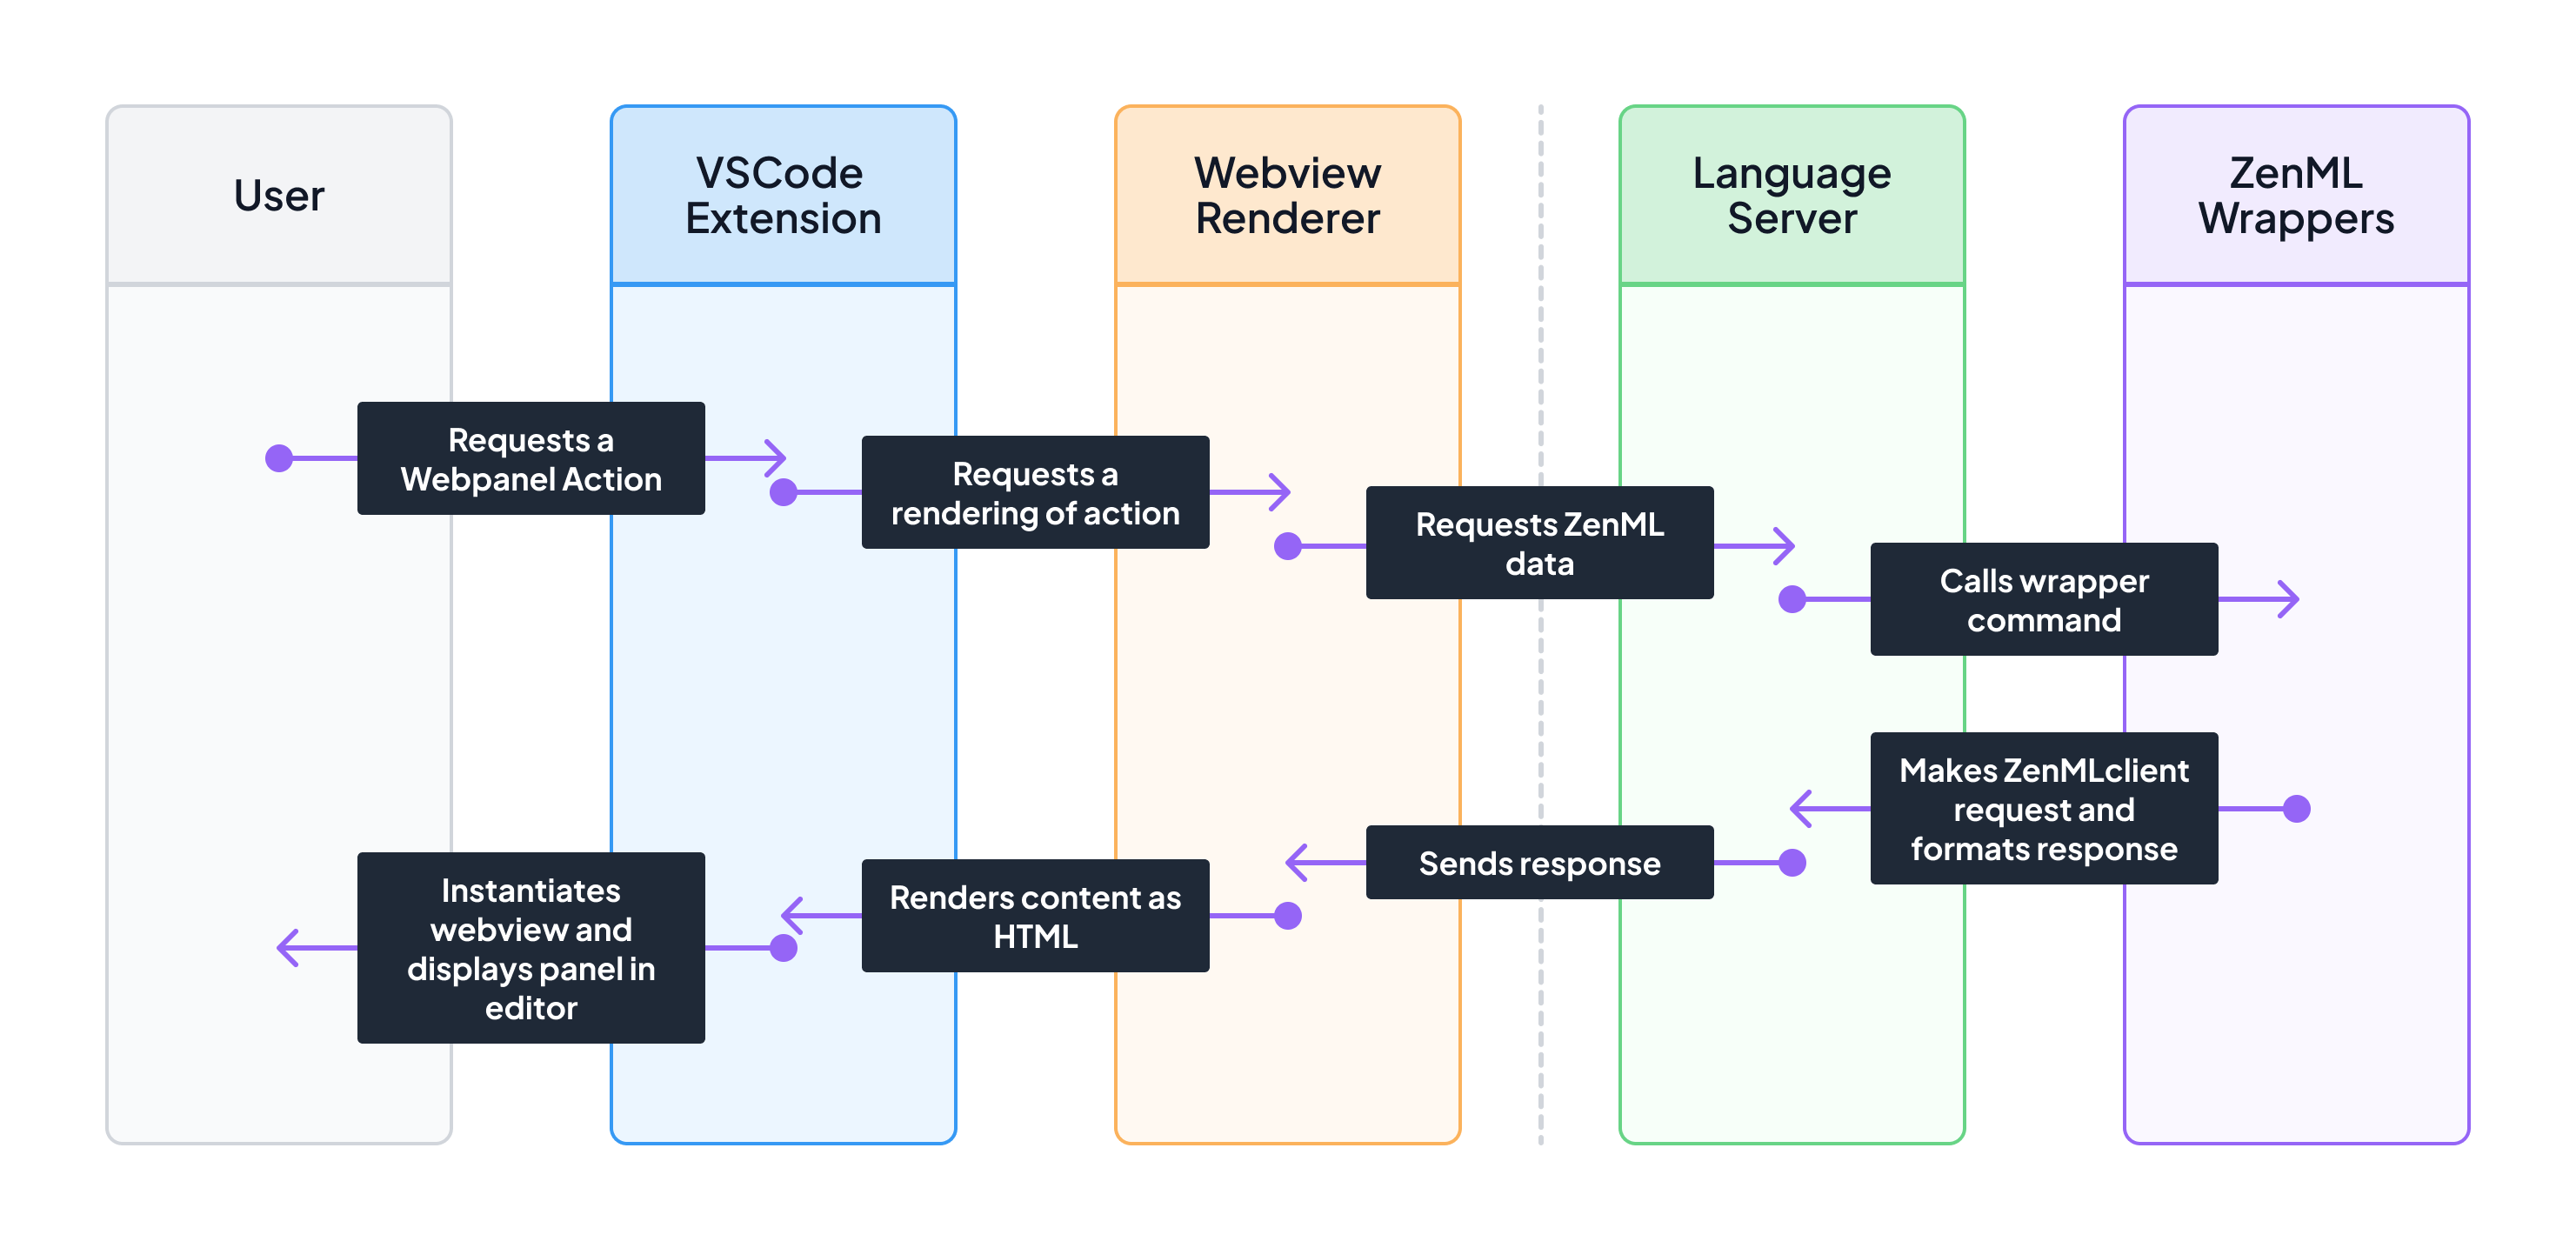
The rendering flow involves several steps. For each feature, I wrote an action inside a wrapper for the Language Server. The extension would then request this action and build the HTML for the webview, which is subsequently rendered. This approach optimizes performance and ensures a smoother user experience.
Messaging
For messaging, I used a consistent schema across both features. The data exchanged between the extension and the webview is formatted as a simple object, like this:
interface Message {
    command: string;
    data?: any;
}
“The DAG feature’s webview primarily operates independently after being rendered, so it doesn’t need to receive messages. However, to display data for each clicked node, it sends messages with the command indicating the node type and the data containing the node’s ID. The extension then handles the request and displays the corresponding information.
The stack feature forms are slightly more complex. Each form can only be loaded into a single webview instance. These forms are pre-rendered as new registrations and then receive a message to set their mode to either ‘register’ or ‘update.’ If the mode is ‘update,’ the message includes the relevant data for the object being updated. When the form is submitted, it sends a response back to the extension, with the command indicating the operation mode. Context retention is enabled for these forms to prevent the loss of input data when the webview is hidden.
DAG
If you understand how to make web forms, the stack feature isn’t quite different from a rendering and processing point of view. Rendering a graph is a bit more interesting.
Rendering
The ZenML dashboard retrieves graph information using the ZenML server API and displays it with a combination of React.js, dagrejs, and ReactFlow. Dagrejs handles the layout of the individual steps and artifact nodes, while ReactFlow is responsible for rendering the graph. ReactFlow uses inline SVGs for the edges and overlays HTML elements for the nodes. However, this approach wasn’t suitable for the VS Code extension due to its resource intensity.
Rendering the graph with React.js and ReactFlow was deemed too heavy for the extension. Nonetheless, I opted to use dagrejs to maintain consistency in layout between the extension and the dashboard. Dagrejs conveniently calculates both the layout and the edges, leaving only the rendering task.
To render the graph, I selected svg.js and svgdom libraries. These tools allowed me to generate the graph as an inline SVG outside the webview in a way similar to how the edges are rendered on the dashboard. However, unlike the dashboard, I used ForeignObject elements to embed HTML nodes within the SVG. The ForeignObject element allows one to insert standard HTML inside a SVG object, which allows for easy styling of the nodes. Aside from no longer having to overlay the nodes, it simplified the calculations for pan and zoom as well.
Edges
Once I was able to render and style the nodes, it became clear that dagrejs’ default edge calculations wouldn’t work correctly without modification.
As shown in the image, the edges often fail to attach properly to the nodes and instead float in the air. This issue arises because dagrejs calculates node placement based on the maximum possible node size. It generates edge points in the spaces between rows of nodes, connecting them in the shortest possible way. However, since nodes rarely occupy the full allotted space, we end up with these disconnected, hanging edges.
To address this, I recalculated the endpoints of the edges. I removed the initial and final points from each edge, as these connect directly to the nodes. I then added two new points at each end: one centered on the node and another perpendicular to the connecting point. This adjustment ensures that all edges are orthogonal, with every bend forming a 90-degree angle.
Overlapping Edges
The graph now looks great, but there’s one remaining issue: in complex graphs, it can be difficult to discern which nodes are connected due to overlapping edges. This problem also exists in the ZenML dashboard, but there, users can move nodes, dynamically adjusting the edges as they move. Since the nodes in the VS Code extension are static, a different solution was required.
To solve this, I implemented a feature that highlights all edges originating from a node when you hover over that node with your mouse. This interaction makes it easy to see the connections and understand the relationships between nodes.
The edge highlighting feature was somewhat tricky to implement because elements within an SVG do not propagate events in the same way as HTML elements; specifically, SVG elements do not bubble events up through the DOM hierarchy. This meant that additional care was needed to ensure that hovering over any part of a node would trigger the desired highlight effect. I had to carefully manage the event listeners and use specific techniques to ensure that the parent node was correctly identified and affected when any of its child elements were hovered over. This meticulous handling was essential to provide a seamless and intuitive user experience.
API
Initially, I used the Server API to retrieve graph information for the DAG renderer. However, this approach had several drawbacks. Firstly, it didn’t adhere to the extension’s established practice of encapsulating Python client commands, which was a core design principle. Secondly, it didn’t support rendering local pipeline runs when not connected to a server, limiting its functionality for users working offline or with local resources.
Upon further investigation, I discovered that the API utilized a module called LineageGraph to generate the graph data. I decided to leverage this module within the language server to directly obtain the necessary information. This approach initially seemed promising, as testing with a local server yielded satisfactory results.
However, testing with the cloud deployment revealed a significant issue: retrieving graph information for complex pipeline runs could take more than a minute. This latency was particularly problematic and unacceptable for a smooth user experience. The root cause of the delay wasn’t entirely clear, but it was evident that relying on LineageGraph for this data retrieval was inefficient.
To overcome these challenges, I decided to develop a custom solution for generating and retrieving graph data. This new implementation took direct inspiration from LineageGraph, directly transforming a Pipeline Run to graph data. Testing of the new solution found that the delay caused by directly using LineageGraph ****was completely eliminated.
Client Updates
As with any project, dependency updates can sometimes lead to unexpected issues. Since the ZenML VS Code extension was first created, ZenML itself has upgraded its Pydantic dependency from version 1.x to 2.x. This change caused some problems, particularly with the client encountering exceptions when converting responses to JSON. The extension relied on this functionality to retrieve server information, leading to compatibility issues with the newer client version. Fortunately, the solution was straightforward: I avoided converting to JSON and instead manually constructed the necessary dictionary.
Additionally, the release of the ZenML 0.63 client introduced another challenge by removing the version field from the PipelineRunResponse. This change broke the pipeline runs view in the extension. The fix was simple—removing all references to the now-absent version field.
It’s interesting how a seemingly minor update can ripple through dependent projects, causing issues that require attention and quick fixes.
Conclusion
The further development of the ZenML extension for Visual Studio Code has successfully enhanced the tool’s capabilities, providing features like DAG visualization and stack management. By leveraging webviews and carefully handling data flow and UI design, the extension integrates seamlessly with ZenML while remaining efficient and user-friendly.
Challenges such as adapting to new dependencies and client updates were addressed promptly, ensuring the extension’s stability and compatibility. The project demonstrates the importance of thoughtful design and adaptability in creating effective developer tools. The work done sets a strong foundation for future enhancements, ensuring the extension remains a valuable asset for ZenML users.
Christopher Perkins is a software engineer and an open source contributor. He is always anticipating the next problem and enjoys tackling challenges head-on. Feel free to connect with him on LinkedIn.